
Unfortunately, the link you clicked is a page that is not currently available.
Please contact us with any questions.
Just in case... here are some popular links that might be what you were looking for:
A FREE Operational Freedom Strategy Call with Steve!

The ONLY Operational Problem-Solving Newsletter for the MSP Industry!
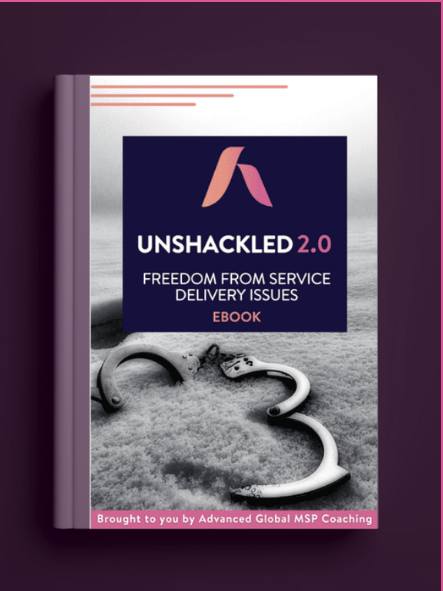
Unshackled: Freedom From Service Delivery Issues eBook